WebMD Symptom Tracking
WebMD provides consumers with the latest news, drugs, health, and wellness information. It also offers several tools to help users manage their health such as the Symptom Checker, Doctor Directory Guide, Drug Savings Program, and Medication Reminders.
Overview
Symptom Checking is the most trafficked tool in the WebMD app. The goal of this project is to ideate on ways to retain users once they have interacted with this tool.
Year
2021
Role - Lead Designer
User Research
Ideation
Wireframing
Prototyping
Low and high fidelity designs
Usability testing.
Tools Used
Figma, Whimsical, Zeplin, Validately
Goals
Ideate how we might allow users to track symptoms after interacting with the symptom checker tool.
Create an integrated and seamless tracker experience
Research
Our user research and user testing aim to uncover whether our ‘track symptoms’ tool would be useful to our current user base. It will also test if the current concept is working and pinpoint areas of improvement on our initial wireframes
Findings
Manual
Currently users use manual methods such as excel, Evernote, the native note taking app, a journal or notepad to track their symptoms
Timing
Users expressed that they often forget to track their symptoms because they are forgetful/lazy about it, it takes too much time, and they don’t think its worth it since they can’t input enough detail
Tedious
Current trackers often don’t have enough custom input fields or they take a lot of time to fill out. Users expressed the need for something that isn’t time consuming and easy to use.
Design Strategy
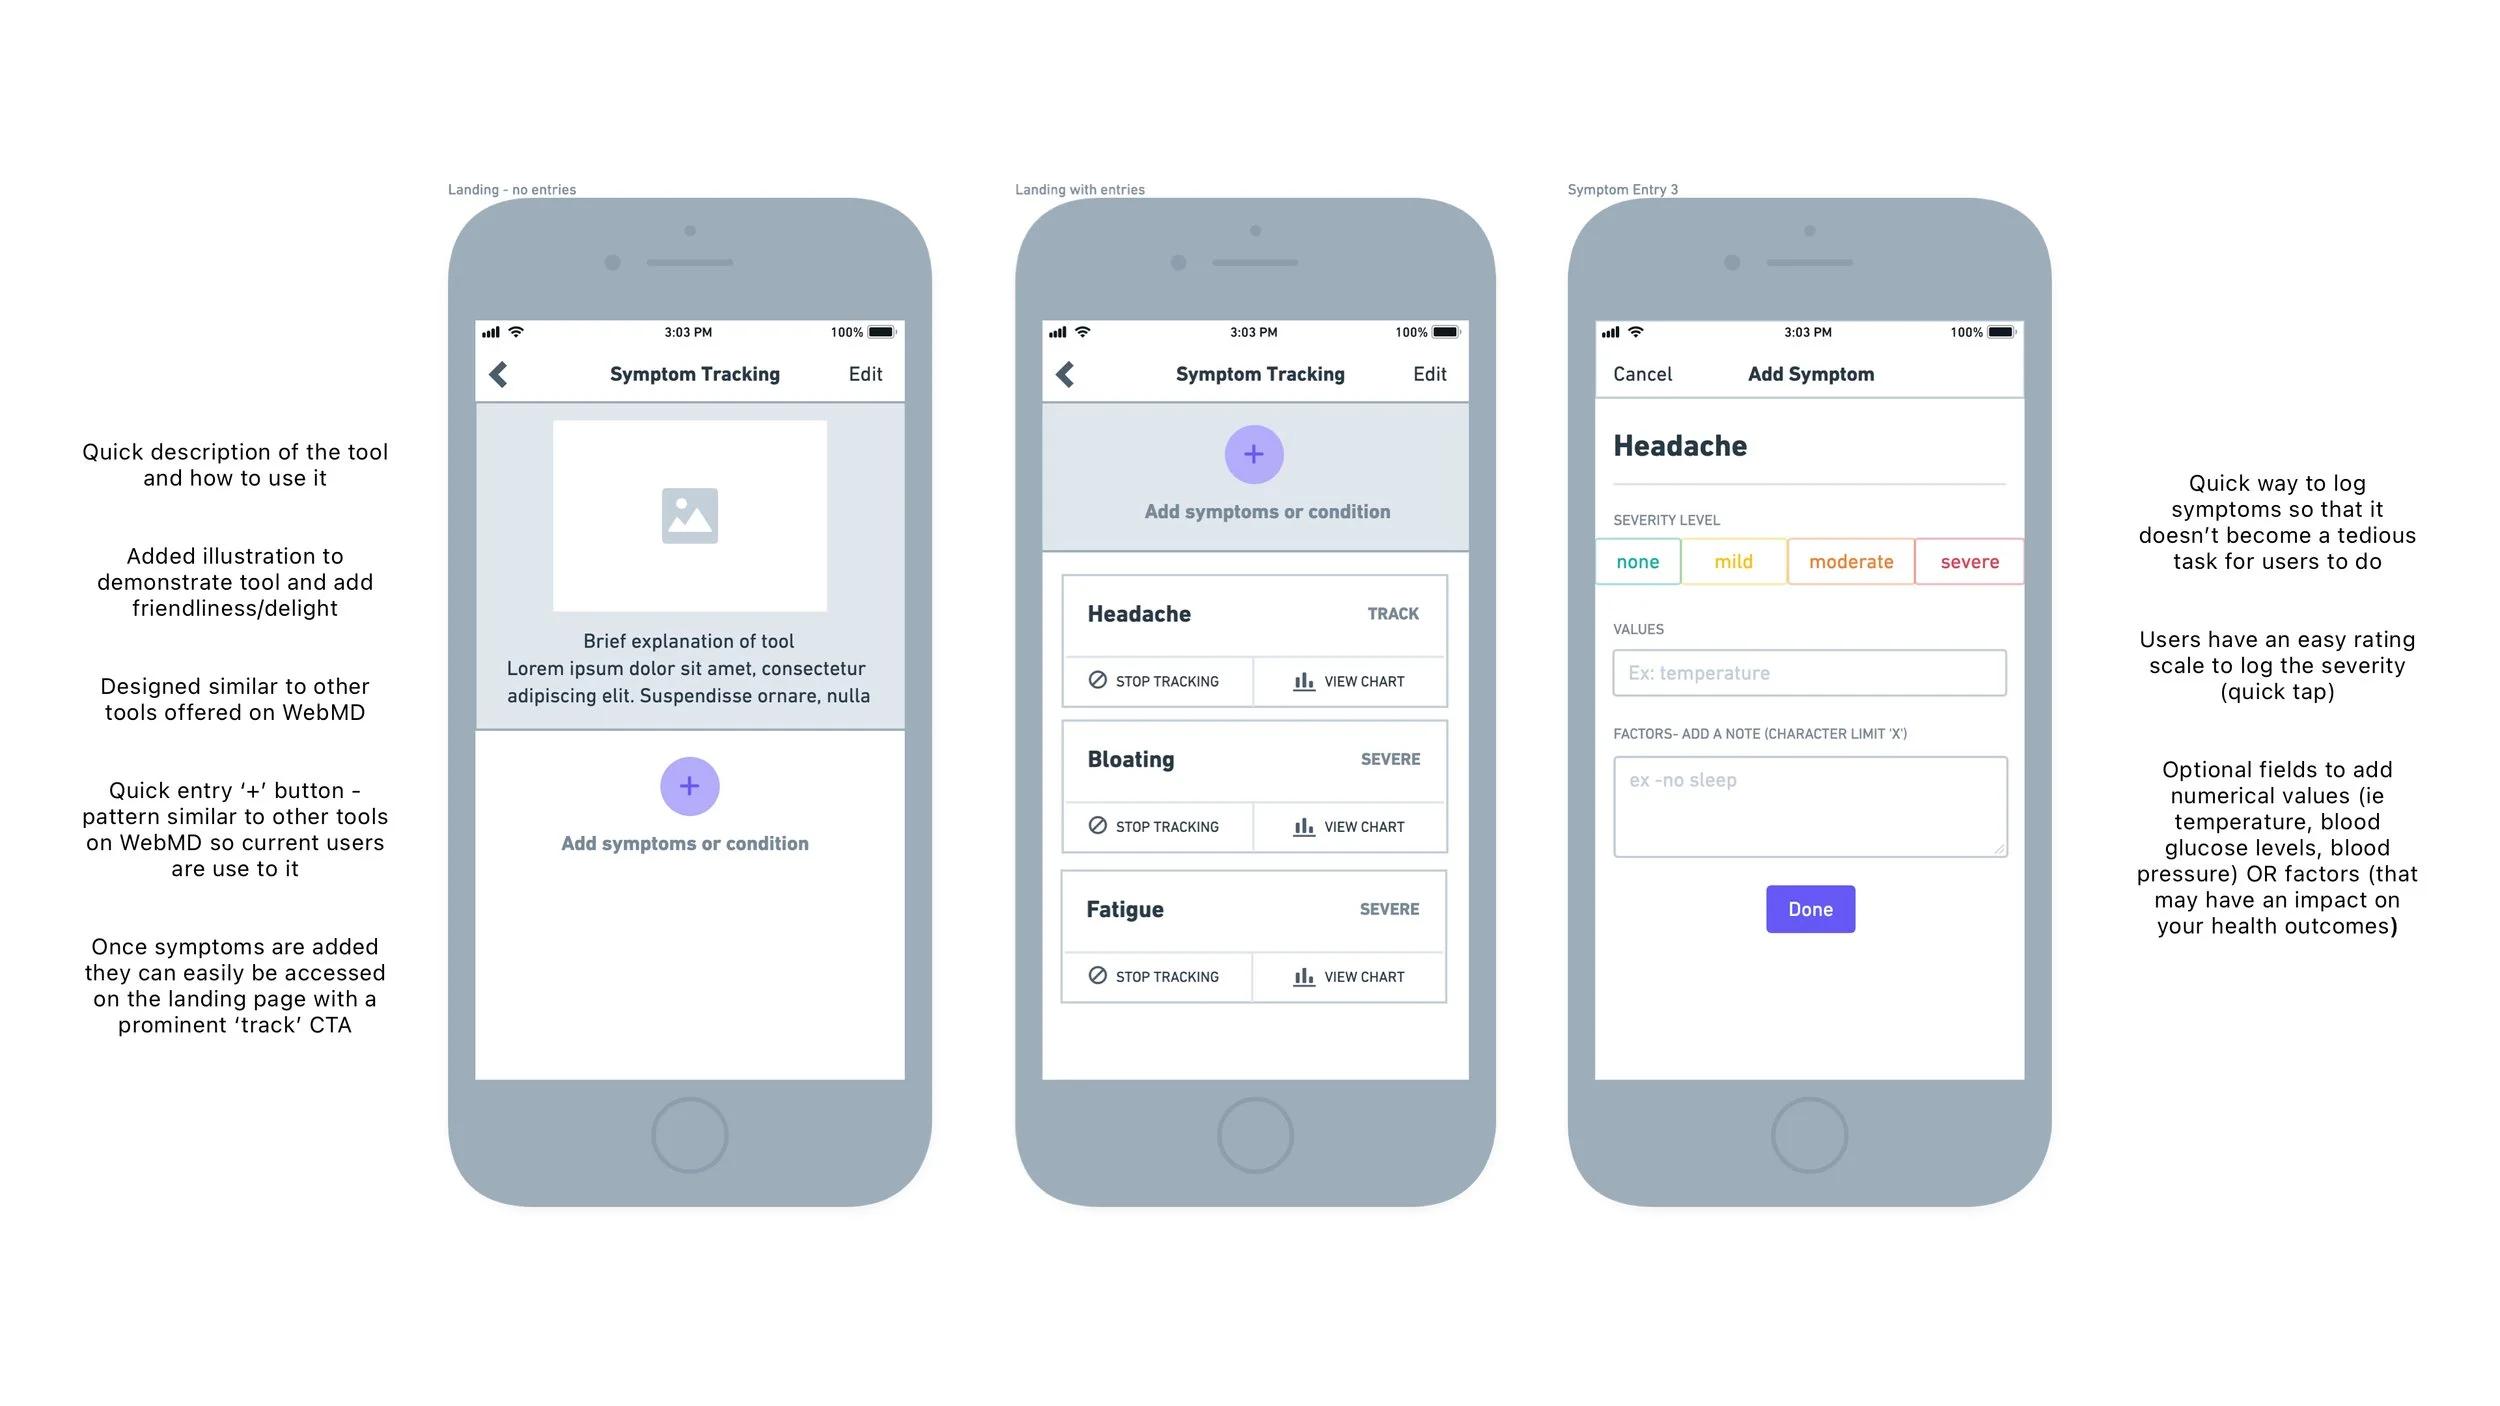
Make it Easy
Offer a quick way to input how you’re feeling either upon app entry, or app widget
Daily Reminders
Remind users to input their symptoms daily through push notifications or in app alerts
Quick Entry
Make the tool easy to use with quick data entry and the option to add more details.
Unmoderated testing with six individuals. Task-driven to see if they understand the flow and how to use the tools offered. Follow-up questions to gauge interest and further improvement opportunities. Finding include:
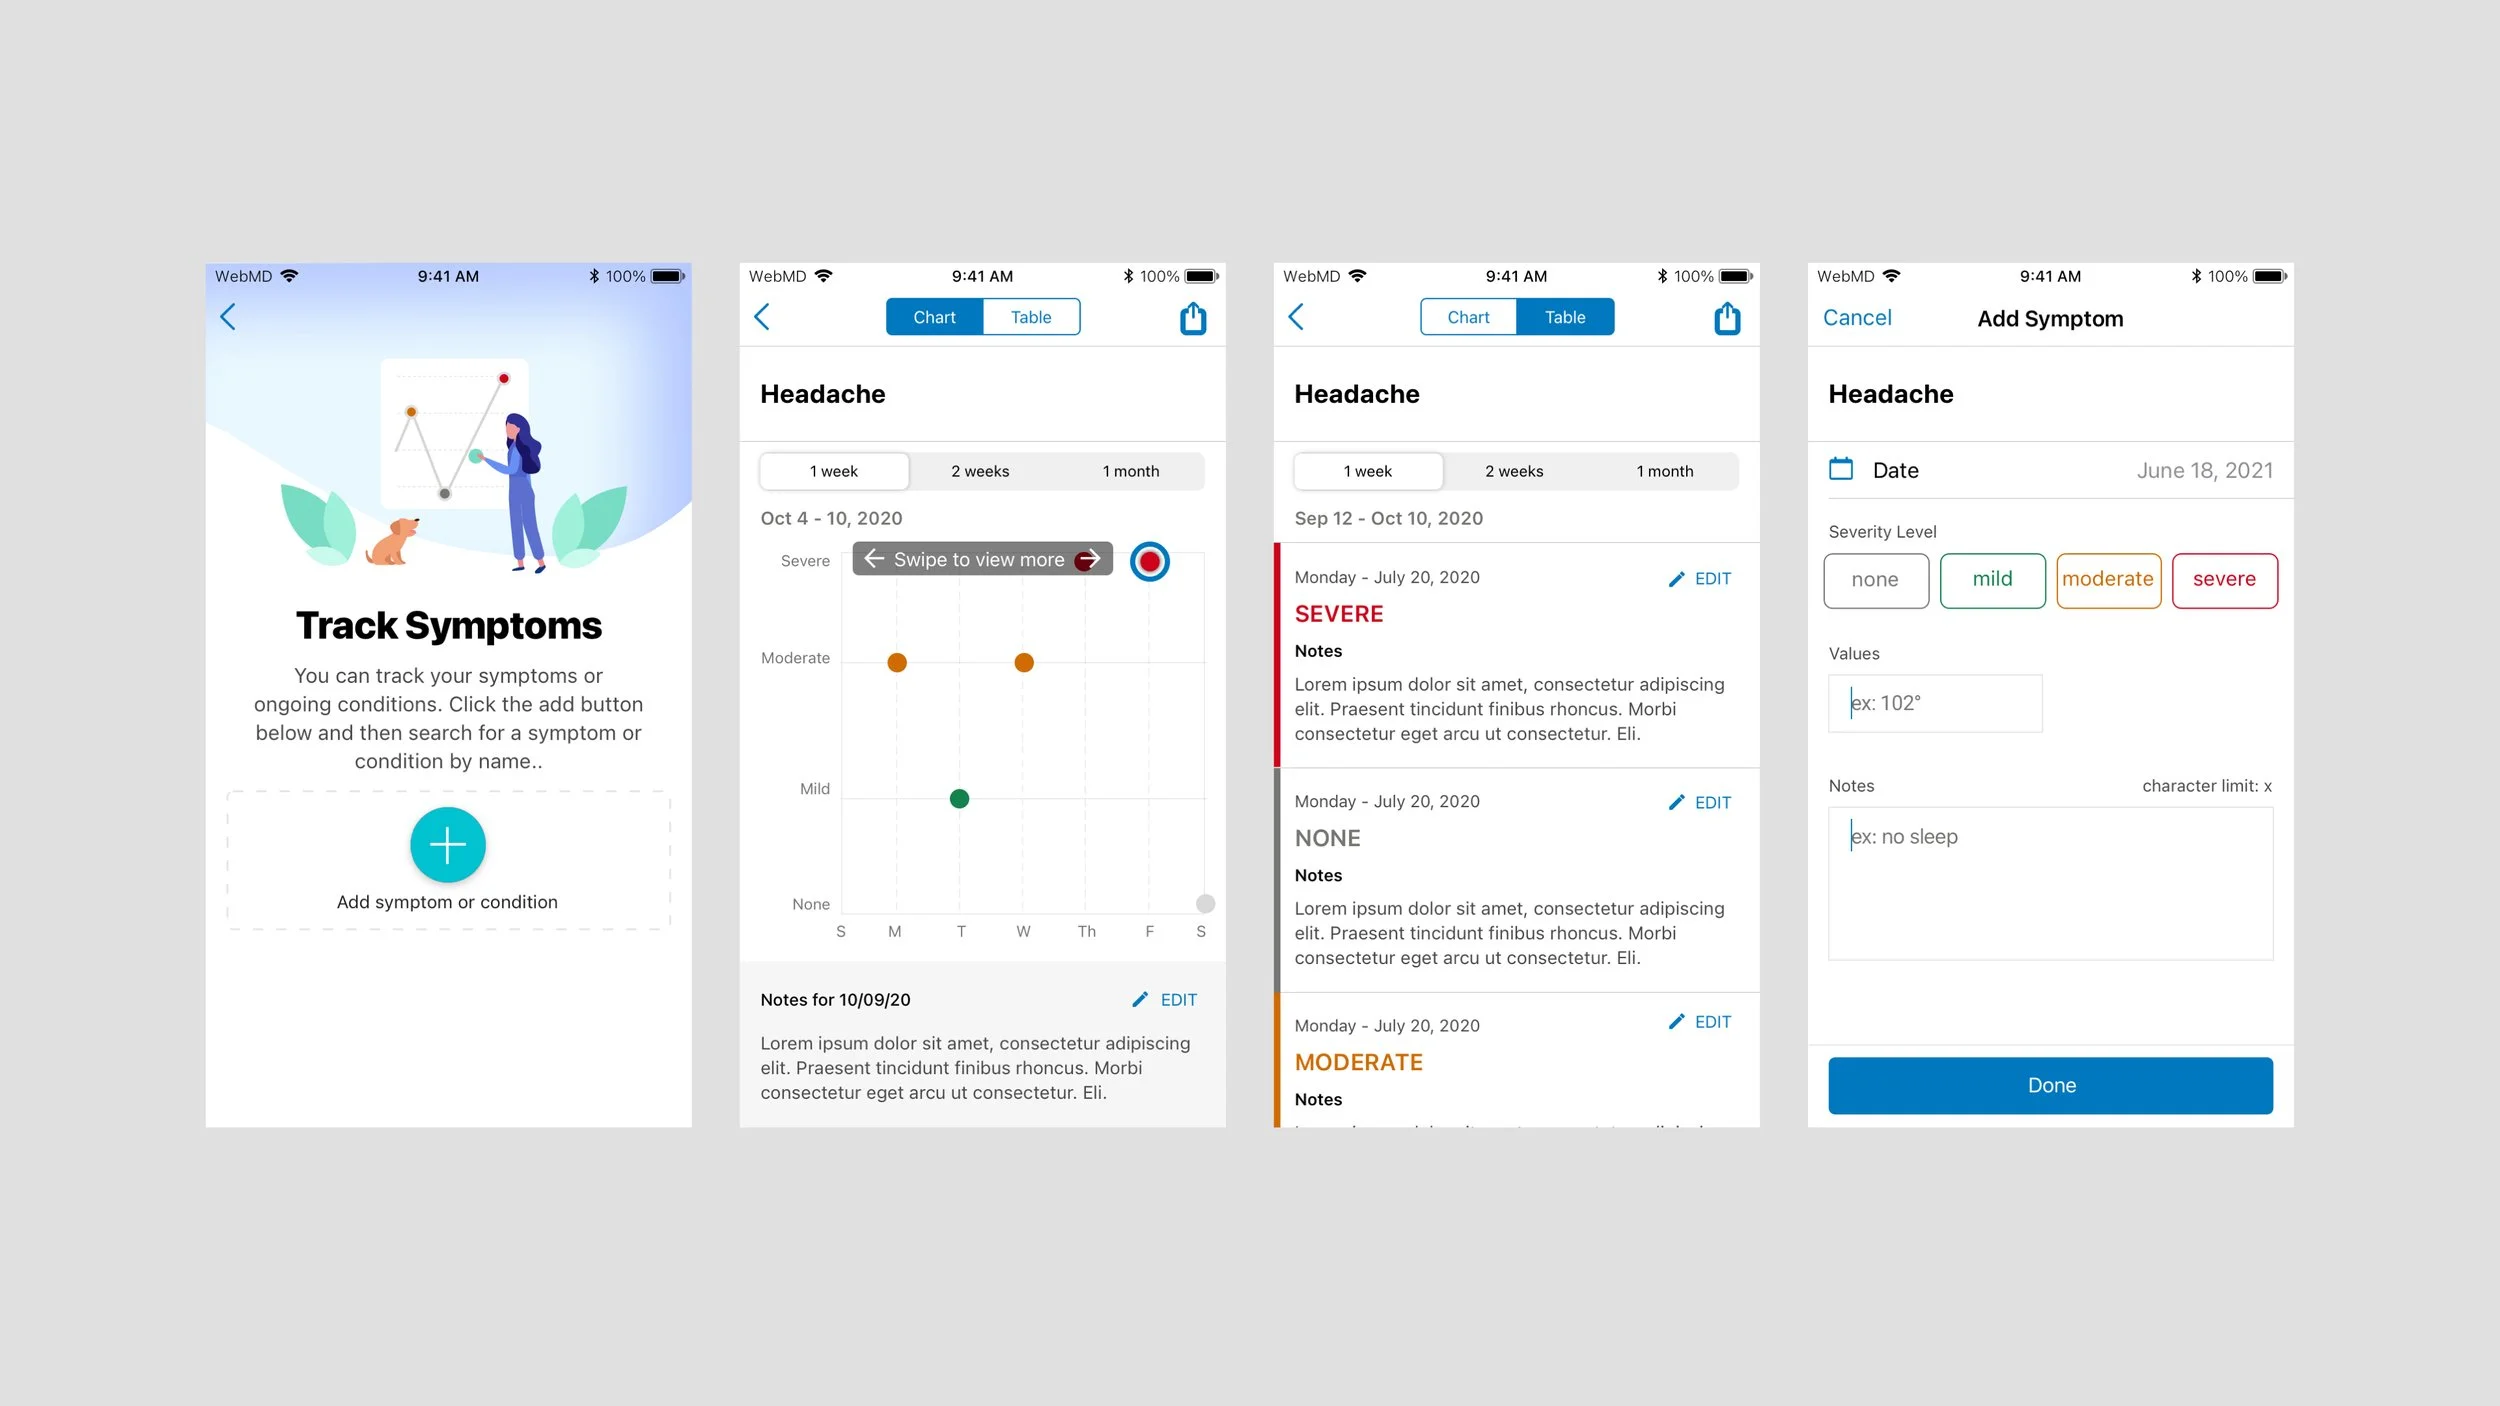
Easy way to expand chart and view logged information
Confusion around the word ‘factors’
Add brief instruction to ‘+’ button
Interaction (added animation and tweaking of elements to make changes more obvious)
Usability Findings
Final Designs